
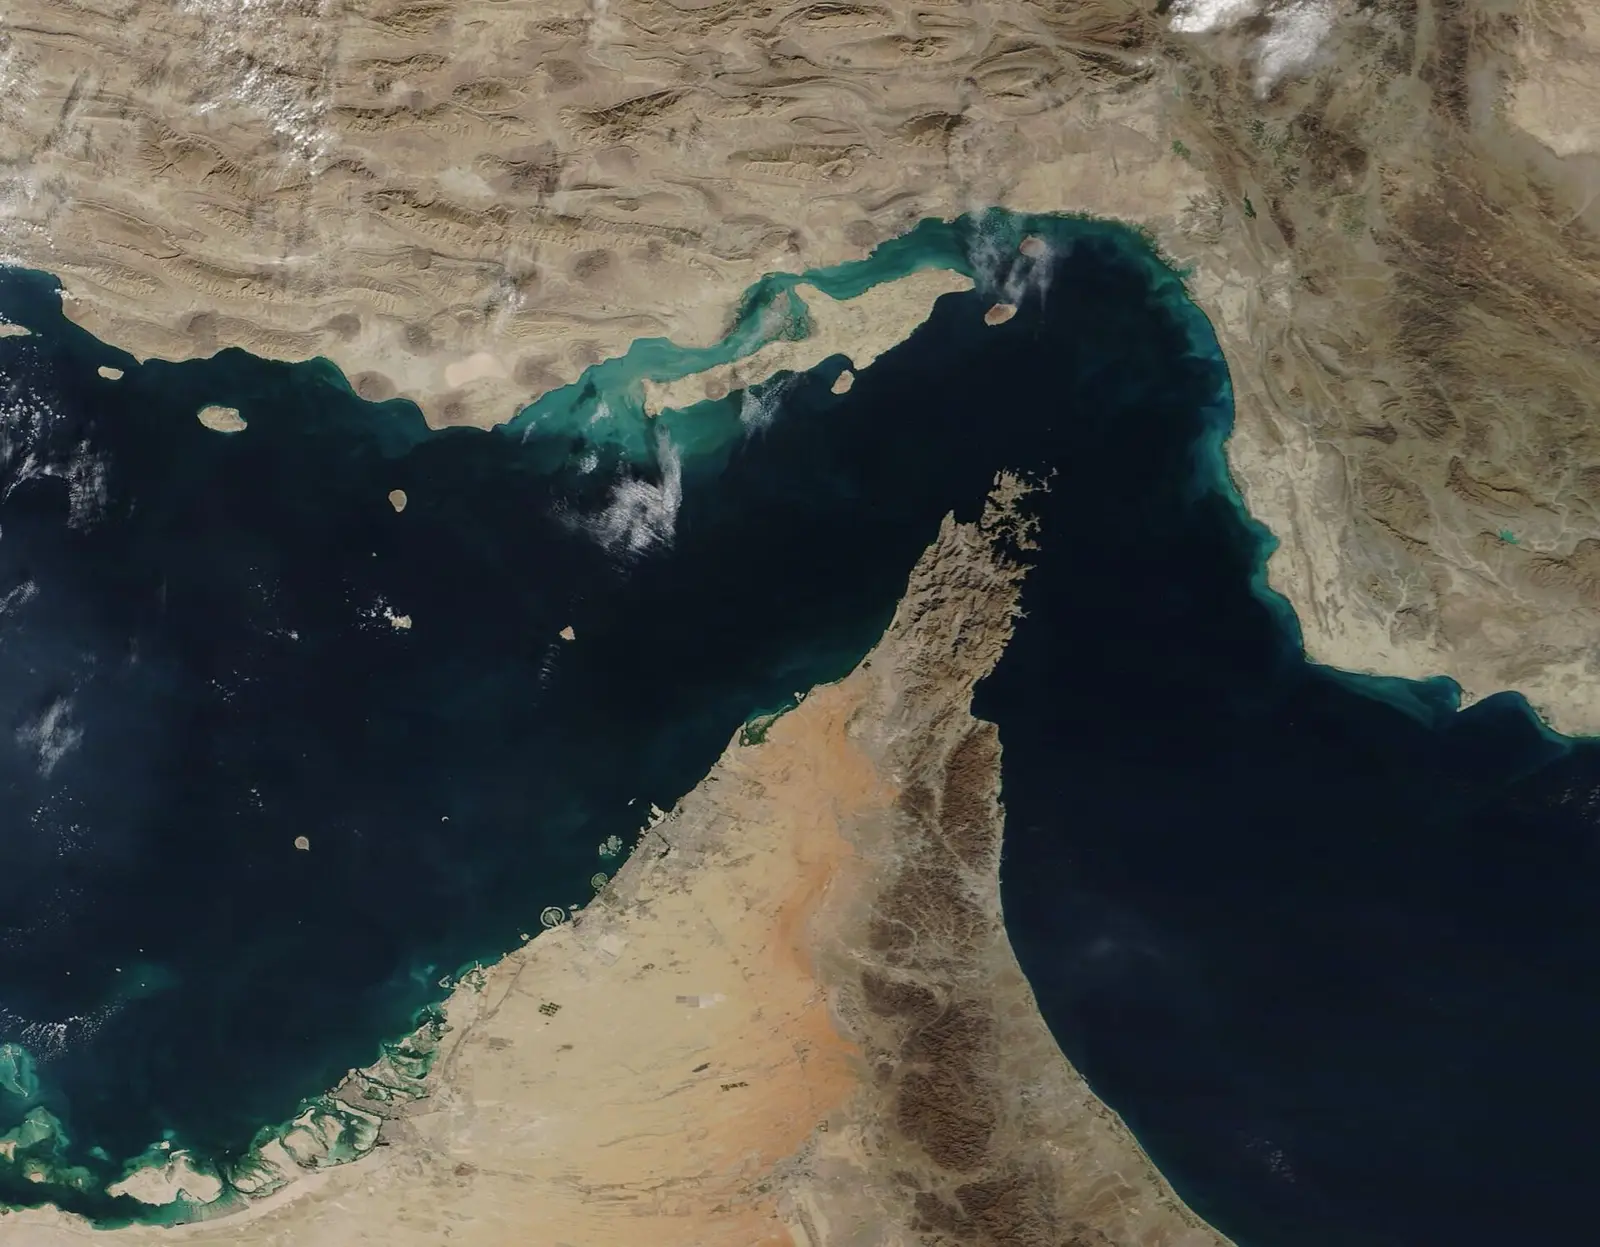

Look at a map of the Gulf and the geography explains itself. Saudi Arabia, Iraq, Kuwait, the United Arab Emirates, Qatar, Bahrain and Iran all border a body of water with a single exit to the open ocean. For decades, analysts asked what would happen if that exit closed. Until 2026 the honest answer was that nobody knew, because it never had.
It has now. This explainer sets out what passed through the strait, what official data say happened when traffic collapsed, and what the episode does and does not tell us.
What used to pass through
In 2024, according to the US Energy Information Administration (EIA), about 20.7 million barrels of oil a day moved through the Strait of Hormuz: roughly a fifth of everything the world consumed and about a quarter of all oil traded by sea. Around a fifth of global trade in liquefied natural gas (LNG) took the same route, nearly all of it from Qatar.
The customers were overwhelmingly Asian. EIA estimates that 84% of the crude and condensate went to Asian markets in 2024, with China, India, Japan and South Korea the largest buyers. A crisis in the Gulf is therefore also a crisis of Asian energy security.
The limited ways around
Two pipelines can carry crude to ports outside the strait. Saudi Arabia’s East-West line runs to Yanbu on the Red Sea; the International Energy Agency (IEA) gives its design capacity as 5 million barrels a day, and Saudi Aramco has said it can move 7 million. The UAE has a line to Fujairah on the Gulf of Oman with a capacity of about 1.5 to 1.8 million barrels a day.
Together they can replace only a fraction of normal traffic. For Qatar’s gas there is no alternative at all.
What the data show
EIA publishes quarterly estimates of traffic through the strait:
| Period | Oil, million barrels a day | LNG, billion cubic feet a day |
|---|---|---|
| Oct–Dec 2025 | 21.6 | 10.5 |
| Jan–Mar 2026 | 15.0 | 7.4 |
| Apr–Jun 2026 | 5.1 | 0.8 |
| Jul–Sep 2026 | 9.1 | 1.4 |
In April, EIA’s forecast was headlined “Hormuz closure” and estimated that six Gulf producers had together shut in 7.5 million barrels a day of output in March, simply because the oil had nowhere to go once storage filled. Brent crude, the international benchmark, averaged $103 a barrel that month. EIA now expects it to average about $97 across 2026, compared with $69 in 2025.
By October, the IEA reports, Gulf exports had recovered to 18.4 million barrels a day, still 26% below their pre-war level.
Treat these numbers with care. EIA warns that the ship-tracking signals it relies on have been especially unreliable since the end of February and that its 2026 estimates are revised frequently.
Why prices did not simply follow the barrels
It would be natural to assume that the oil price mirrors the lost supply. The record is more complicated, and the IEA’s monthly reports point to at least four forces at work:
- Lost supply. The closure removed millions of barrels a day from the market.
- Stocks. Importers drew down inventories; the IEA counts a cumulative fall of 462 million barrels in observed global stocks since the war began.
- Demand. High prices and economic disruption reduced consumption. The IEA forecasts that world oil demand will fall by 2.7 million barrels a day in 2026.
- Rerouting and recovery. Pipeline exports and a partial return of tanker traffic restored some supply.
The result is that prices have moved in both directions while the strait remained restricted. The IEA notes that benchmark prices fell from a high of $136 a barrel in early October to $93 by mid-November, yet were still about $22 above pre-war levels.
There is also very little cushion left. The IEA estimates that spare production capacity across OPEC+ was just 0.45 million barrels a day in October, partly because so much of the world’s spare capacity sits inside the Gulf itself.
Who is exposed
For exporters the effect cuts both ways. Higher prices raise the value of each barrel, but barrels that cannot be shipped earn nothing. Saudi Aramco’s results, and through them the Saudi budget, depend on both, which is why this is a volume shock for the Gulf as much as a price windfall. Our explainer on Gulf interest rates and the dollar peg looks at the consequences for policy.
For importers, dearer energy raises costs for households and businesses and feeds into inflation, which central banks have responded to: see how interest rates move through markets. The same disruption has affected shipping more widely, as described in our explainer on trade routes.
What the episode has and has not settled
It has settled that the strait can close, that bypass routes cover only a minority of the flow, and that the world’s buffers, stocks and spare capacity, are finite.
It has not settled how quickly normal traffic returns once it is able to, how much production capacity comes back, or what a lasting change in buyers’ behaviour looks like. On each of those, the next official data releases will say more than any forecast.